
Let's say you've been working on your project for awhile, but can't shake the feeling that it is performing sluggishly. More importantly, your client is also unhappy with the code's responsiveness. Remember, your code doesn't need to be fully optimized. 80% of the gains generally come from focusing on 20% of the code. Make sure you have a good reason to die into performance optimization before you do so. Per Knuth, "We should forget about small efficiencies, say about 97% of the time: premature optimization is the root of all evil."
Categories
There are two main categories for code being slow:
- CPU-bound : Your code is doing a massive amount of computation, which causes the code to stop until all this computation is complete.
- IO-bound : Your code is stuck waiting for a resource to return. This could be the hard disk, a network request, or something else -- but your CPU is forced to twiddle its thumbs until the resource is available.
While technically classified as IO-bound, I would argue that thread contention, where multiple threads continually fight over a shared resource, is a third category. The basic idea is that, because multiple threads are trying to access the same resource, at least one of the threads will execute more slowly than it would if otherwise run in isolation. I will not attempt to cover thread contention here, but if interested, you may want to look into Visual Studio's Resource contention data (concurrency) profiling method.
Perhaps you have no idea why your code is slow. Where do you begin?
This is where profiling comes in.
Types of Profiling
Visual Studio supports 2 modes of profiling: Sampling and Instrumentation.
Sampling is a light-weight solution; it periodically polls the running binary, checking metrics such as what function is currently executing, how much memory is consumed, etc. However, because it needs to rely on polling to gather information, it can miss short changes in program state (the default polling interval is every 10 million clock cycles, or 10 milliseconds on a 1 GHz machine). The only pieces of code that will show up in a sampling report are those that happen to be executing when the polling interval triggers. This type of profiling might be a poor choice if your program primarily consists of quick, short functions, as the results will likely be distorted by whenever the the polling interval fires. It is a terrible choice if your program doesn't even last a full polling interval. However, if you are just starting trying to identify bottlenecks in your code, sampling works well, because these bottlenecks are likely to be long-running functions that will span multiple polling intervals. NOTE: Sampling is restricted to user-mode code. Because of this, according to Microsoft, "some functionality, such as input and output operations, is not captured by sampling". Also worth noting, is that as of this writing, sampling is not configurable on Windows 8+ (Windows 7 still allows setting the interval rate and sampling type).
Instrumentation is the more heavy-weight approach. It will effectively trace through the entire path of the binary as it executes. Because of how heavy-handed this approach is, it can visibly affect performance. However, once you've identified a time-consuming part of your program (through sampling), instrumentation allows you to drill down into the finer details. With instrumentation, you can closely examine all memory allocations/deallocations, all function calls, and how much time each portion of the code takes.
So, back to your code. You have a giant blob of slow code, and you don't know where to start. Provided your code runs for a while, I'd lean towards sampling for that initial pass -- you'll quickly get a rough sense of what code is responsible for the bulk of the samples. At that point, you can fire up a more targeted instrumentation session to get more specific details. How do we do that?
Profiling in Visual Studio
Visual Studio exposes its profiling via its Performance Explorer window. You can access this window directly via Debug->Profiler->Performance Explorer, however this window won't be of much use without a configured profiling session.
A better way to start out is to use one of the following, equivalent commands:
Debug->Performance ProfilerDebug->Profiler->Performance ProfilerAnalyze->Performance Profiler
Any of the above will open a wizard to start the profiling session. In most cases, you'll want to set:
- Analysis Target: Startup Project
- Available Tools: Performance Wizard
and then click "Start"
On the next page, select either CPU Sampling or Instrumentation. In most cases, you'll be fine leaving this page as-is, with the desired project selected for profiling. Click "Next". On the final page, you can decide to launch the profiling immediately or wait.
Sampling
When the report comes back, you'll see something like the following:
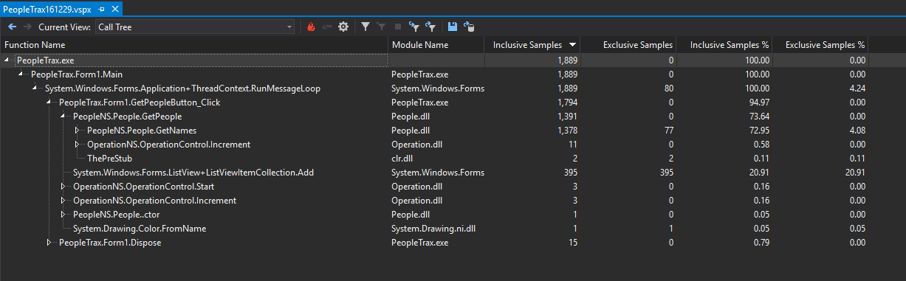
I'm using the PeopleTrax sample application, which can be found under the SourceCode/Chapter11/4_Performance directory. Microsoft tutorials refer to the sample application, but their links appear to have expired.
Here, I'm looking at the Call Tree view, which is a good place to start to get a general idea of what is consuming the bulk of the time in your application. If you click on the fire icon in the toolbar, called Expand Hot Path, it will drill down into the actual function which is responsible for the bulk of the work. In this case, it looks like we're spending the bulk of the time on System.IO.StringReader.ReadLine. We know this by looking at the Exclusive Samples field. Inclusive Samplesindicates the total number of samples a function and all of its subcalls include. Exclusive Samples, by contrast, contains only the samples that this function (and not its subcalls) is responsible for. So, in this case, ReadLine is responsible for 876 inclusive and exclusive samples -- it's the end of this callstack. PeopleNS.People.GetNames, its caller, has 1,378 inclusive samples, but only 77 exclusive ones. If we were to look at GetNames in the Function Details view, we'd be able to see that only 4.1% of the samples are in the function itself. Most of the work is delegated out to ReadLine, TrimHelper, Add, and GetString.
A more established profiler might be able to discern the problem from sampling alone. However, I started my profiling with the assumption that most of the time was going to be spent on reading and processing the data, and that largely seems to be the case here. Also, I want to shine light on Instrumentation, so...let's fire up an instrumentation session!
Instrumentation
First, you should notice two things:
- Our application was much less responsive; the list view took longer to populate.
- The performance graph took a lot longer to load. As I mentioned previously, the downside of Instrumentation is that it is a much heavier. In this case, we can clearly see it affecting program performance, and it also makes us wait longer for the performance results. For those reasons, if we could have gotten away with it, relying on Sampling alone would have been better.
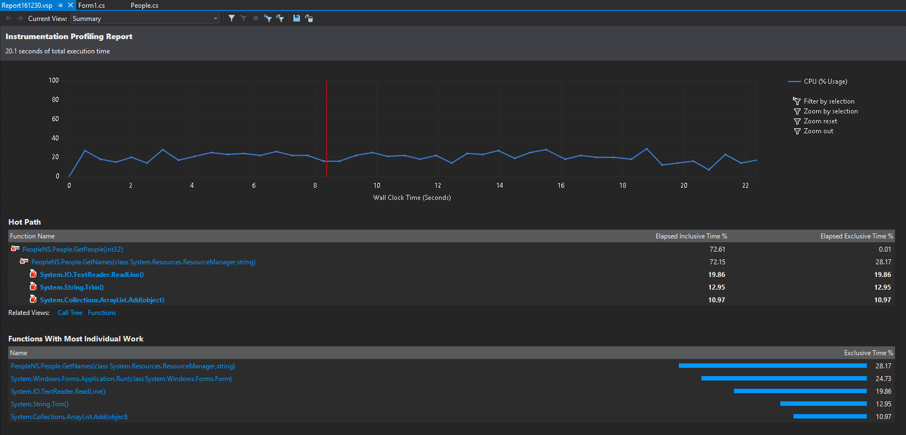
The Summary View changes a little bit of our view -- ReadLine still does a lot of work, but between itself, Trim, and Add, we've only accounted for around 40% of the execution time, yet the calling function, GetNames, consumes 72% -- what is account for the remaining 30%? Let's click on the GetNames method to look at the function details.
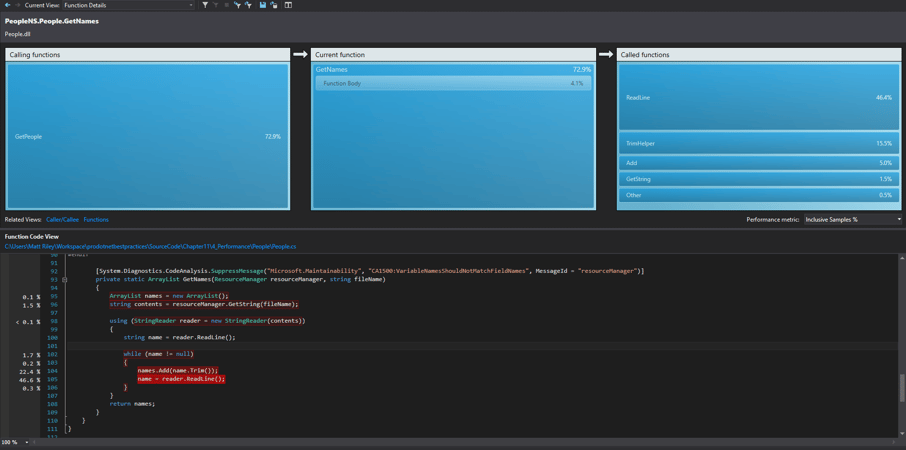
Can this be right? This code primarily does its work through child functions, and the big functions seem to be accounted for. Are we spending time in the ArrayList or StringReader constructors? Probably not, but we can click the Otherbar in Called Functions to find out. It will bring us to the Caller / Callee view, which confirms that the constructors aren't taking much time -- both of the constructors are 0.01%.
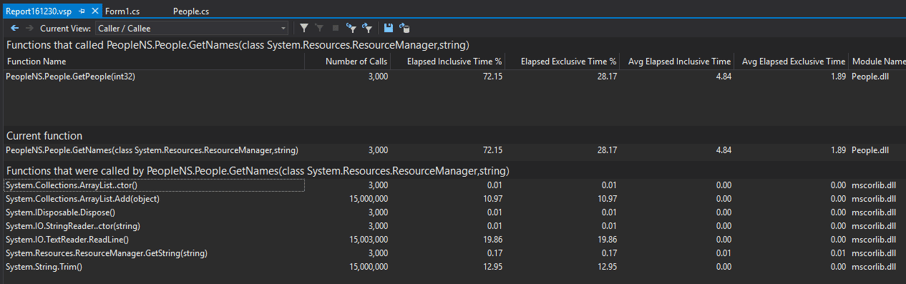
However, looking carefully at this view, some things do stand out to me.
First, we see actual time values, not just percentages. We can also right click any of the headers to add additional fields we'd like to look at. Here, let's add Elapsed Inclusive Time. With this field, we can now set a benchmark for our optimizing efforts -- right now, we are spending ~14.5 seconds in GetPeople. Sure, this value is inflated by the extra instrumentation overhead, but 15 seconds is going to feel long for most of my our users. This is definitely why our program feels slow.
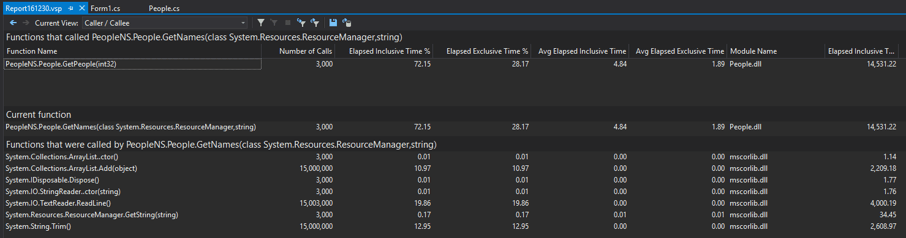
Second, we can see call counts for each function. GetNames is being called 3000 times. WHY? Judging by the method signature, it should return all the "names" in our database. Calling it the next 2,999 times won't do anything differently than it did on its first run. Maybe the result isn't being cached, so let's move up the callstack to see how GetNames is being used; right click GetPeople and click View Source.
Sure enough, we are not caching these values, although ironically, we are set up to do so. This function fetches numberpeople, but for every person fetched, it overwrites this._fullNames and this._companyNames. That's where the 3000 calls are coming from. Let's cache these values outside of the for loop and profile again, to see if we made any improvements.
Now, even with the instrumentation, the program feels snappy. ReadLine isn't showing up on our hot path anymore, because the bulk of time is now spent just waiting for GUI input.
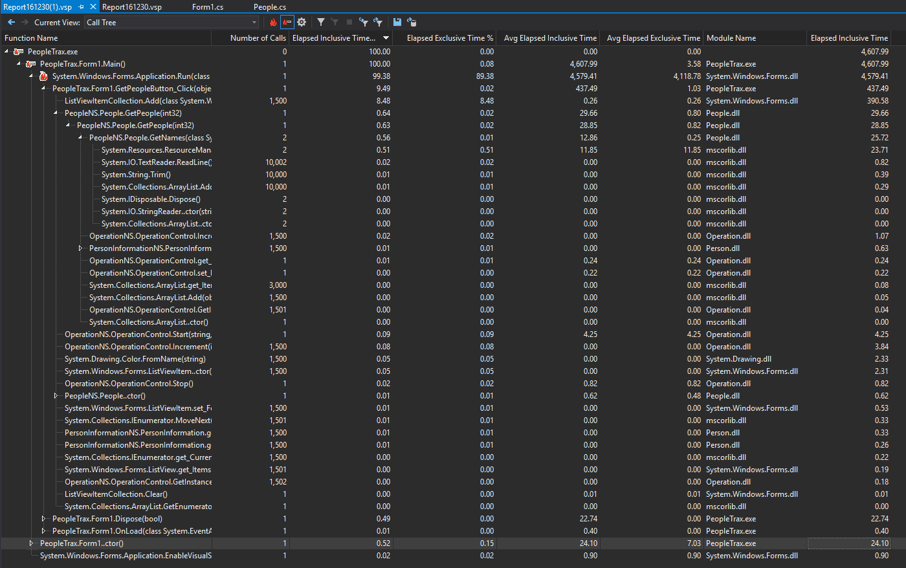
I can see GetNames now is called only 2 times (once for the names, once for the companies). GetPeople now only took 30ms, for a 99.8% improvement in our responsiveness!
Keep Going?
We could drill further; for example, if a user were to click "Get People" multiple times, we are going to overwrite our _fullNames and _companyNames fields, just as before, for no good reason. And we could potentially look at more efficient looping. Right now, GetNames fetches all records, even if GetPeople only needs a few of them. We could look for micro-optimizations, such as moving companyName and fullName's declarations outside of the for loop in GetPeople. But is any of that worth it? Per the 80/20 rule, we already found the small percentage of our code that happened to be the bottleneck, and focusing on that percentage, we were able to boost our performance by 99%. We've got the gains we were looking for, so our time is better spent elsewhere.
Where to go from here
Selective Profiling
If you don't want to profile certain parts of your application, you might be tempted to attach to a running instance of it (Through Performance Explorer->Actions->Attach/Detach). However, with this option, you have limited control, and can only use sampling.
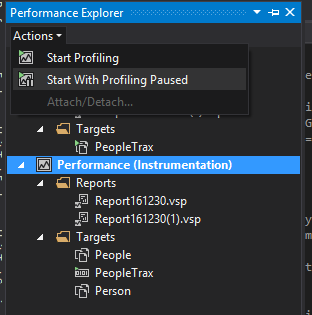
A better method is to create a performance session as normal, but choose not to launch it initially. With this session set as the current session in the performance explorer (right click the session and choose Set as current session) you can then use Performance Explorer->Actions->Start with Profiling Paused. This gives you the flexibility to continually start and stop your profiling to only profile areas of the application you are interested in.
If you need even more precise profiling (or are too lazy for starting/stopping profiling) you have 2 other options:
- Filtering calls by binary
- Filtering calls by method
Filtering calls by binary
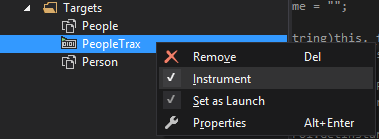
Under any performance session, you'll see the targets folder. Normally, this will only contain a single item, which is generally your main assembly. However, you can add as many targets as you like.
To do so, right-click the targets folder, and select one of the Add options. Each of these targets can be toggled on or off individually -- right click on the desired target and select or deselect the instrument option.
When instrument is enabled, calls which pass through this target are recorded.
Filtering calls by method
You can perform this at either the session or target level. In either case, right-click the session/target and select properties.
Under Advanced->Additional instrumentation options type: /include:<full method signature/wildcard> An example of a full method signature looks like:
SomeNamespace:SomeClass::MethodWithinSomeClass
to grab all methods within SomeClass, you could write:
SomeNamespace:SomeClass::*
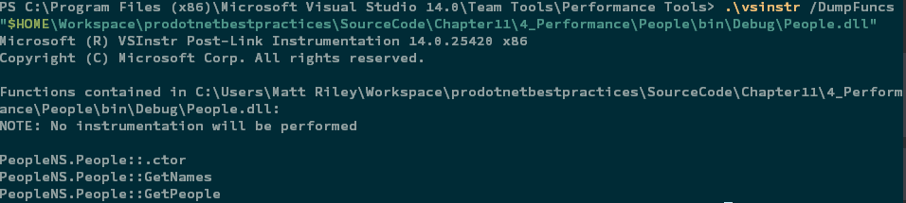
For a full list of functions within a binary, from the commandline, navigate to the Visual Studio Performance tools directory. On my machine, it is located at C:\Program Files (x86)\Visual Studio 14.0\Team Tools\Performance Tools. Within this directory, you can execute vsinstr.exe /DumpFuncs <binary> for a full list of functions
NOTE: This still records all calls from matching functions to external assemblies. However, ignored functions will not show up in the final report, instead having their overhead added to the parent function. For example, if function Lib1.Acalls Lib1.B and Lib2.C, and I am filtering for only Lib1.A, I will get data for Lib1.A and Lib2.C -- Lib1.B will be bundled into Lib1.A's stats.
Common Bottlenecks
Here are examples of some different bottlenecks:
Disk IO
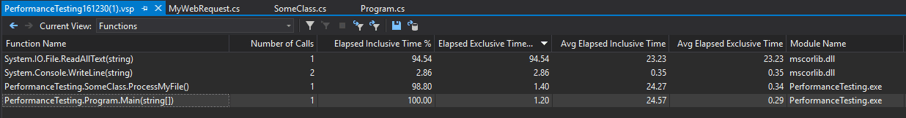
Dominated by System.IO.File.ReadAllText
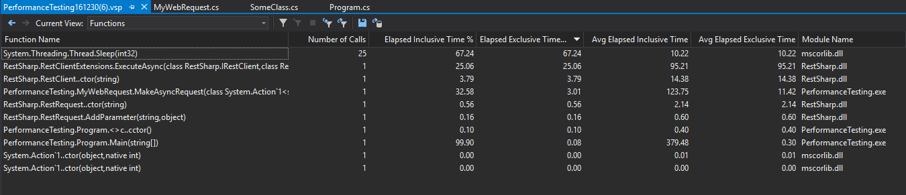
Synchronous Web Requests
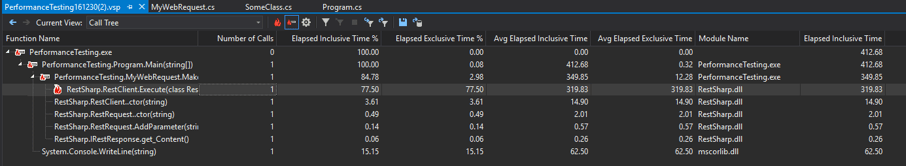
Dominated by RestClient.Execute
Async Task Web Requests
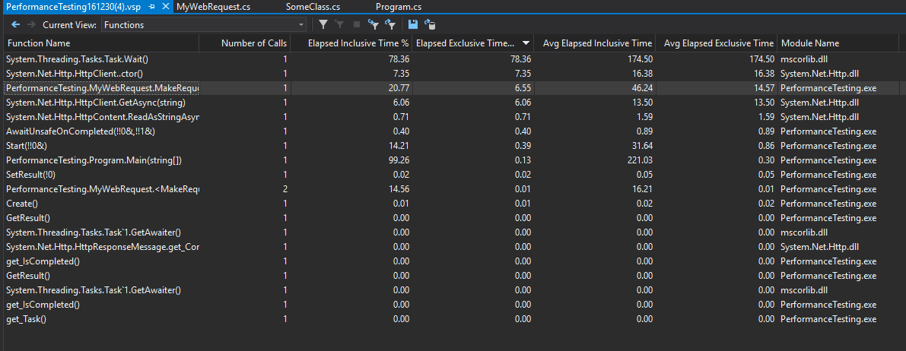
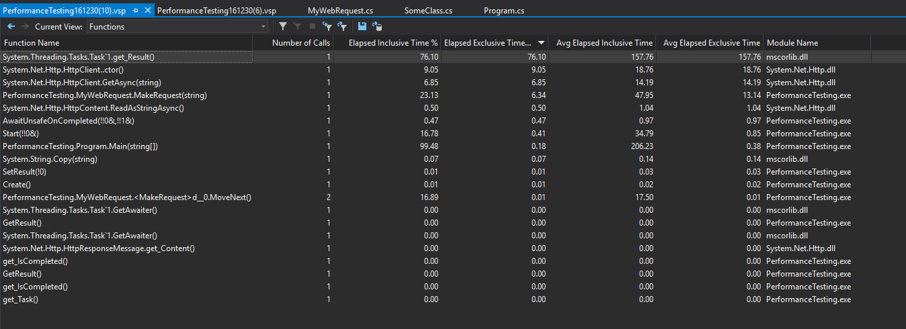
Note that here, Wait/GetResult dominate the output. This is because tasks are a layer of syntactic sugar over what the CPU is doing behind the scenes. As far as the main thread is concerned, it is doing nothing while it waits for the web request to come back. If you need to track individual task times, you'll want to temporarily split them out into their own synchronous methods, or approach it through alternate means (for example, using System.Diagnostics.StopWatch)
Callback Web Request:
Largely the same as the task requests -- the asynchronous call doesn't tie up the main thread, so most of the time is stuck sleeping.
Specifying the Symbol Database
If you are interested in profiling code that hits Microsoft system libraries, and to a lesser extent 3rd party libraries, it is important to update your symbol database. Symbol/PDB files are responsible for linking assemblies to debug information, such as line numbers and variable names. .NET symbol files are relatively minimal, as their assemblies already ship with some debug information. However, if you are working with native assemblies and do not have the associated symbol file, you will be stuck reading machine code. For more information about PDB files, check out: http://devcenter.wintellect.com/jrobbins/pdb-files-what-every-developer-must-know.
To update your symbol database locations (for more details: https://msdn.microsoft.com/en-us/library/89axdy6y.aspx)
Tools->Options->Debugging->Symbols- Select/Check the Microsoft Symbol Servers checkbox
- Create a directory to host cached symbols. Specify this directory on the Cache symbols in this directory field
And that's it! Good luck on your optimization journeys!


