
Visual Studio Code's Pipe transport debug configuration makes debugging many non-standard configurations easy. In this article, I will demonstrate how to leverage this tool to debug a .NET Core application running inside a Kubernetes cluster.
Note: the following instructions assume that you already have kubectl installed and properly configured.
Container Requirements
Before we start debugging, we'll need to have both the debugger and the ps command available on the app's container. The .NET Core Linux installation script is available here.
Assuming that the container was based on the 'microsoft/dotnet:2.0-runtime-deps' docker image, you will need to:
1. Gain access to the container, as follows:
$ kubectl exec -it your-pod-name bash
2. Once inside the container, execute:
$ apt update
$ apt install -y curl unzip procps
$ curl -sSL https://aka.ms/getvsdbgsh | bash /dev/stdin -v latest -l /vsdbg
Setting up Visual Studio Code
On Visual Studio Code, we'll need to:
1. Install C# plugin
2. Set up the launch.json configuration file. Put the following content in the ./vscode/launch.json file (relative to your workspace):
{
    "version": "0.2.0",
    "configurations": [
        {
            "name": "Attach in k8s",
            "type": "coreclr",
            "request": "attach",
            "processId": "${command:pickRemoteProcess}",
            "justMyCode": false,
            "pipeTransport": {
                "pipeProgram": "kubectl",
                "pipeArgs": [
                    "exec",
                    "-i",
                    "your-pod-name",
                    "--"
                ],
                "quoteArgs": false,
                "debuggerPath": "/vsdbg/vsdbg"
            },
            "sourceFileMap": {
                "/path/to/original/source/files": "${workspaceRoot}"
            }
        }
    ]
}
Note 1: The "justMyCode": false will only be required if your app was built with the release configuration. PDB files will always be required to exist on the pod.
Note 2: Remember to replace your-pod-name by the name of your pod and /path/to/original/source/files by the path that was originally used to build your app.
Let's Debug!
Now that we have everything set up, we can debug!
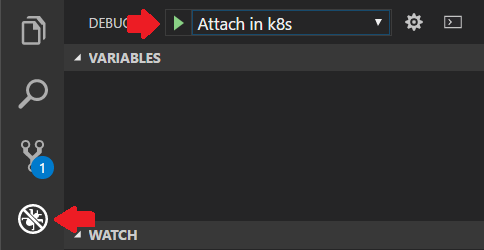
1. Select "Debug" from the side bar, then "Attach in k8s." Finally, click on the green arrow to the left of the drop-down menu.
2. After a while, VS Code will show you a list of running processes from which you can select your app.
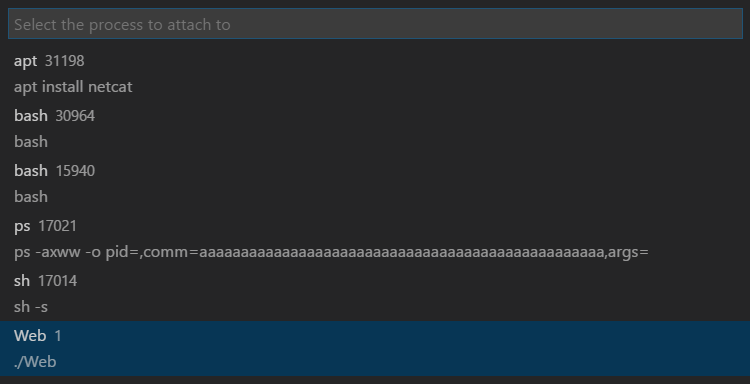
Note: If you have published your app as a Self-Contained Application, the process ID will likely be 1. In this case, you can set the PID configuration to 1 so that you won't have to manually choose it every time.
3. Debug!
After a while, you should see the VS Code debugger toolbar.

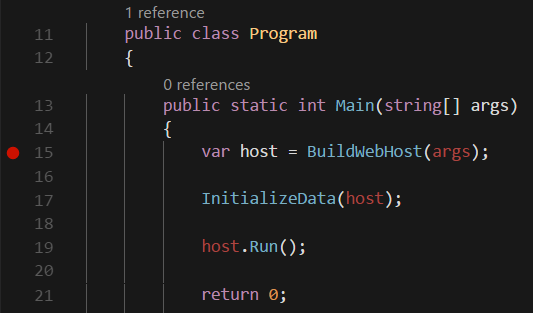
Now you're all set to place your breakpoint and debug your application:
Conclusion
This tutorial demonstrates one of Visual Studio Code's many debugger use cases. A similar approach can be employed in other scenarios like:
Check out more configuration details here, and be sure to tell us how this technique works for you in the comments below!


