
Some time ago I wrote about how to set up a .NET Core Web API to report metrics to New Relic. Now, I'm going to show you how to use New Relic--or any other monitoring platform, such as Azure Application Insights--to get a performance baseline for your API.
What is a Performance Baseline?
A performance baseline is the expected performance of an application under certain conditions. For a Web API, a performance baseline is the average response time at the maximum throughput it can consistently sustain.
Let's say, for example, that a specific endpoint of our Web API in a single node, production-like environment can successfully respond in ~250ms with a throughput of up to 305 requests per minute (rpm). This would be our performance baseline for that specific endpoint.
How are Performance Baselines Helpful?
If we say our baseline is ~250ms at up to 305rpm, we mean that if the workload for our API is less than 305rpm, it will respond in up to 250ms, considering only a single node. But if the workload has 400rpm, it probably won't be able to sustain the 250ms response time.
With this information, we can use the performance baseline to determine:
- - How much we need to scale our application
- - How a new version of the API is performing compared to a previous version
- - If the API is prepared to sustain a specific increase in the usual load
How Do I Determine a Performance Baseline?
In order to determine an application's performance baseline, we need to have:
- - A tool like Apache jMeter to perform the requests in a controlled way
- - A production-like node where we can run the API to obtain the baseline
- - A monitoring tool like New Relic or Application Insights to instrument the API
In this article, I will use jMeter and New Relic to obtain the baseline for the API I created in my last post.
-
Preparing Data
-
Before starting the baseline determination procedure, it's important to select a good data set and data source. I say both because not only do we need to control the data used to obtain the baseline (since we need to use the same data every time we need to compare different versions), but we also need to know the time our API takes to obtain this data.
-
Consider, for example, that our API consumes another API to obtain some input data, or maybe it needs to get data from a database. In these cases, the performance of the real data sources can vary, so we need to replace these data sources with something that allows us control over our own API response time. Tools like Wiremock and Mountebank are good candidates for this job.
- Remember that the data returned by these mocked services must be true representatives of production data that has eliminated outliers (specific cases where the response time would be too far from the average).
-
The Baseline Determination Procedure
-
There are different ways to determine an API's performance baseline. Here I will show the one I consider most informative. For this procedure, we have to:
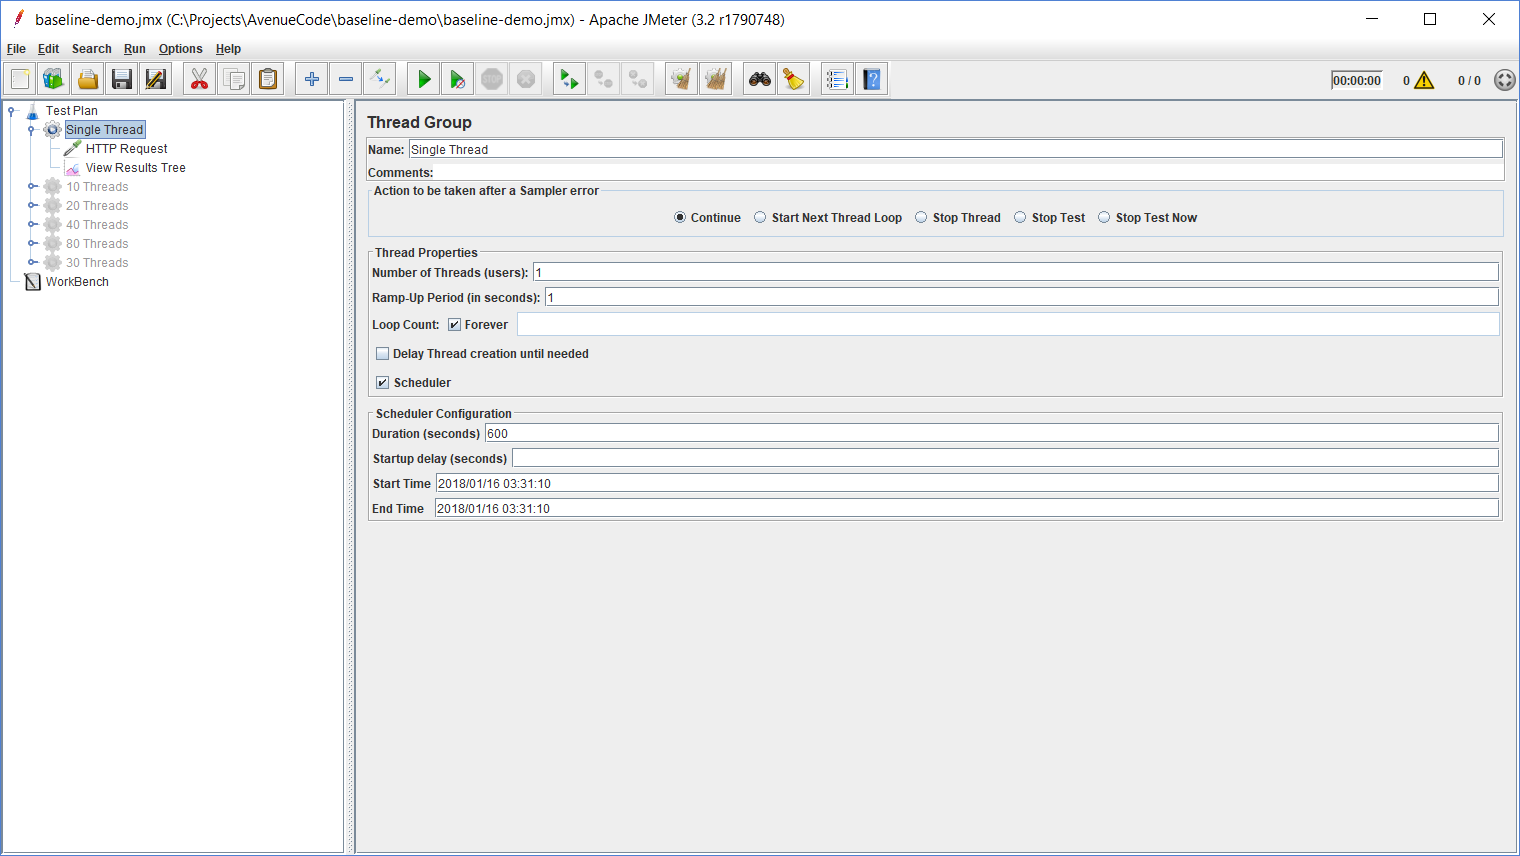
- - Use jMeter to perform the requests, starting with a single thread during 600 seconds
- - Use a Gaussian Timer to control the interval between the requests
- - Increase the number of threads and the Gaussian Timer parameters to control the throughput
- - Monitor the API via New Relic to identify when the API performance starts decreasing
- - Get the baseline values from the last stable run
Show, Don't Tell
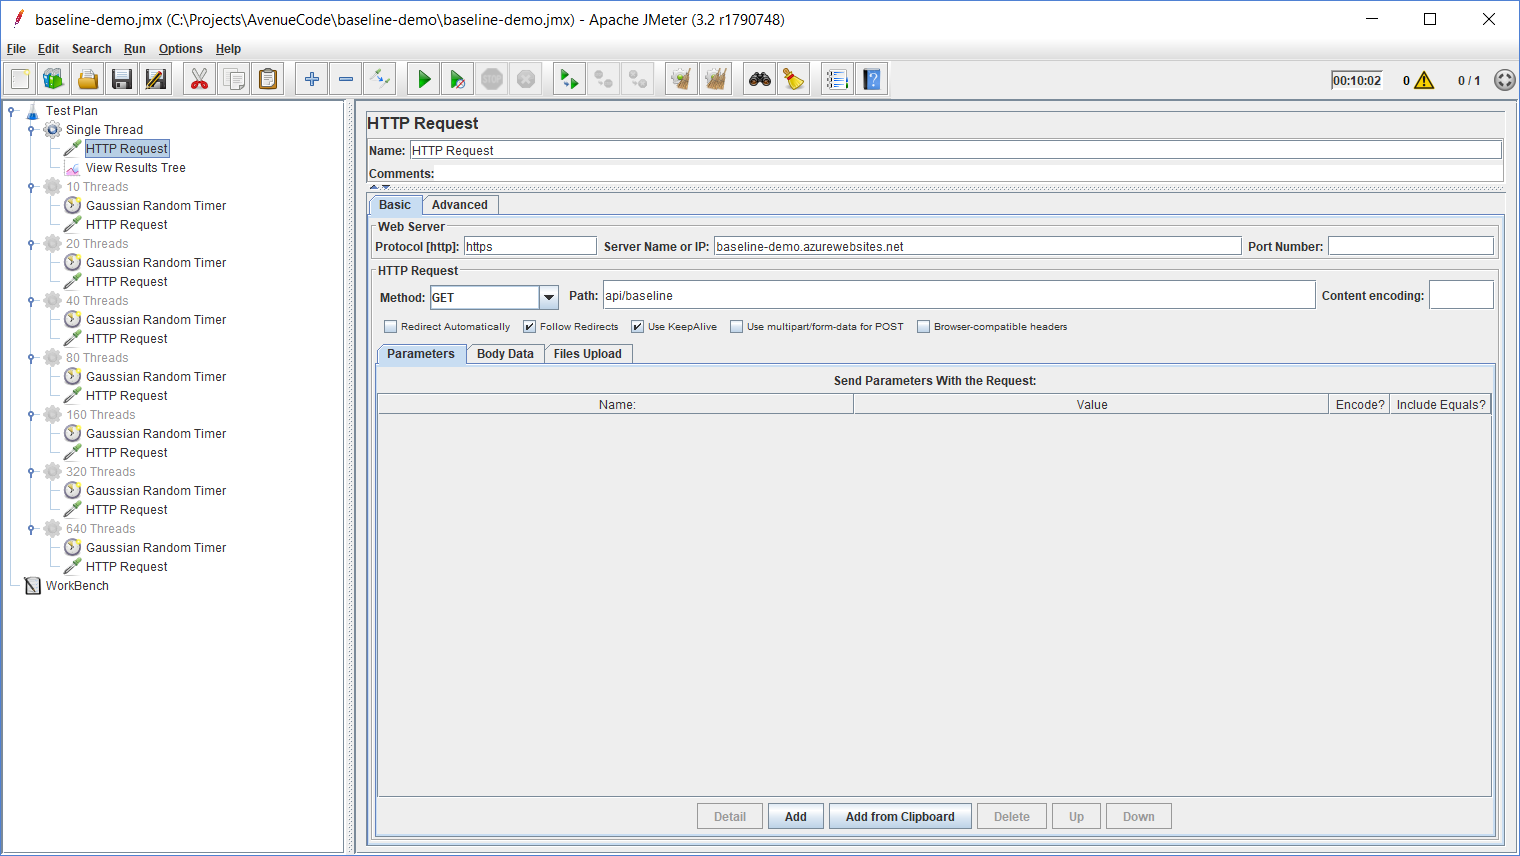
In this section, I will show some screenshots illustrating the process described above.In this first request, all we have to configure in jMeter is an HTTP Request node querying our service endpoint.
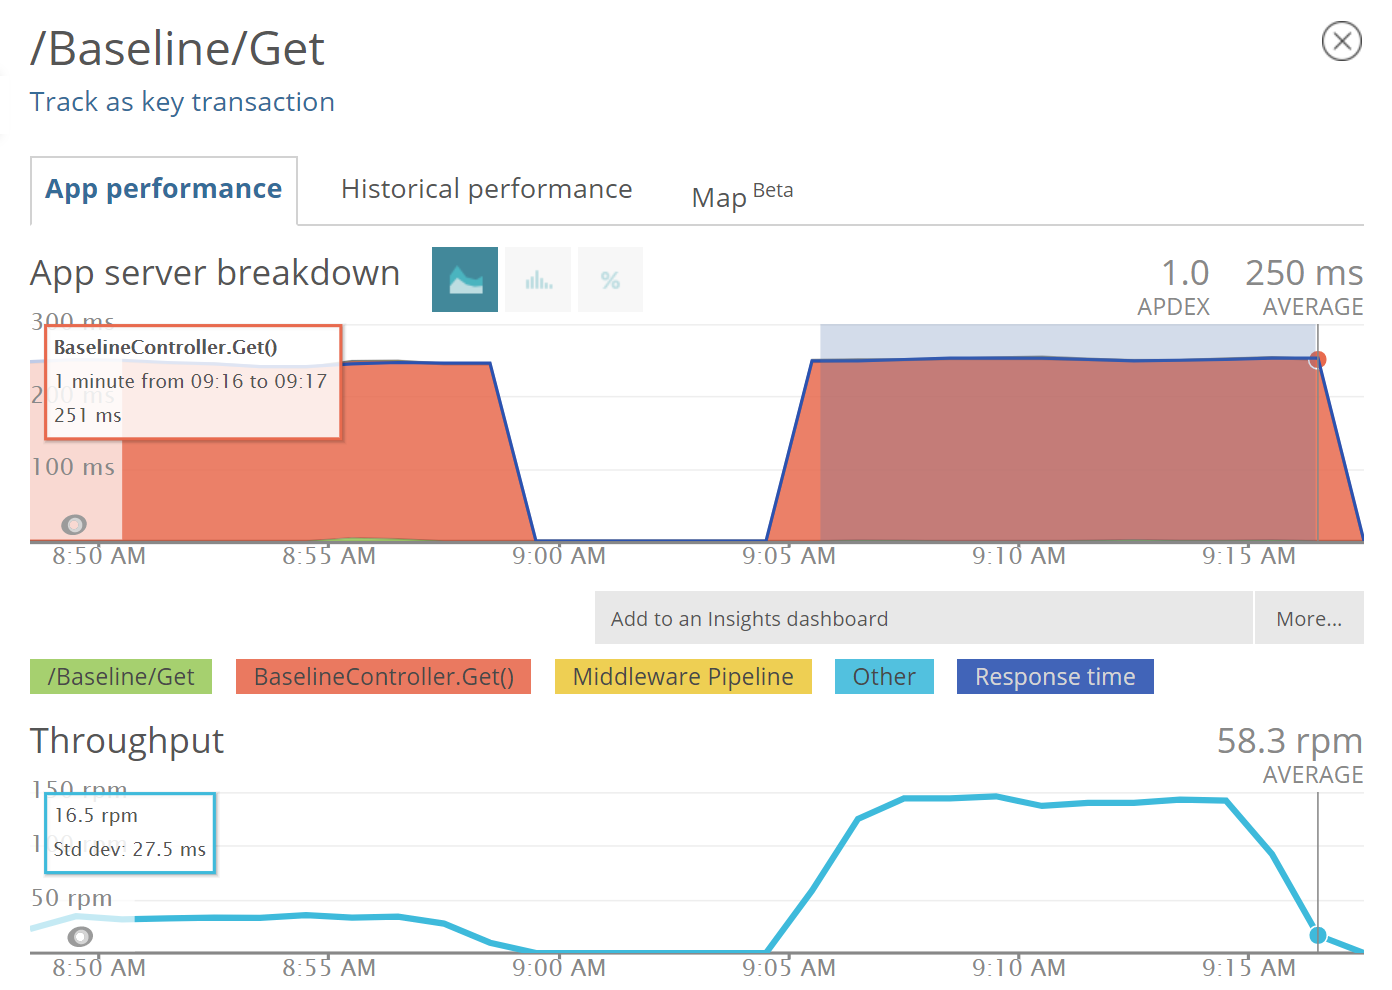
This request is important to give us our reference response time, which we can get from New Relic: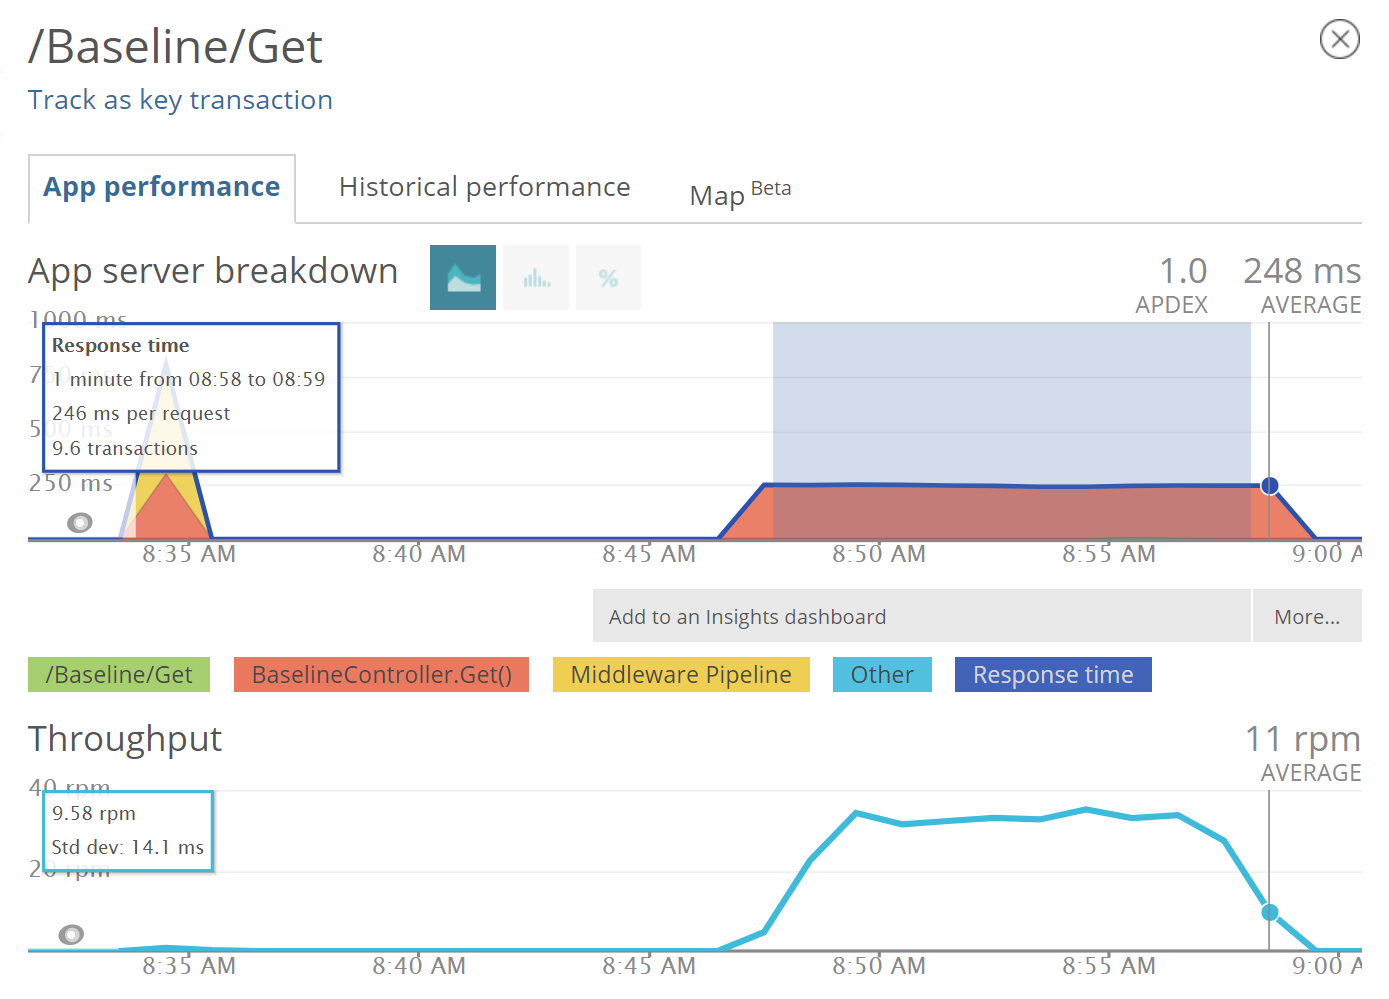 By selecting an interval where we see a constant response time, we get our reference average response time:
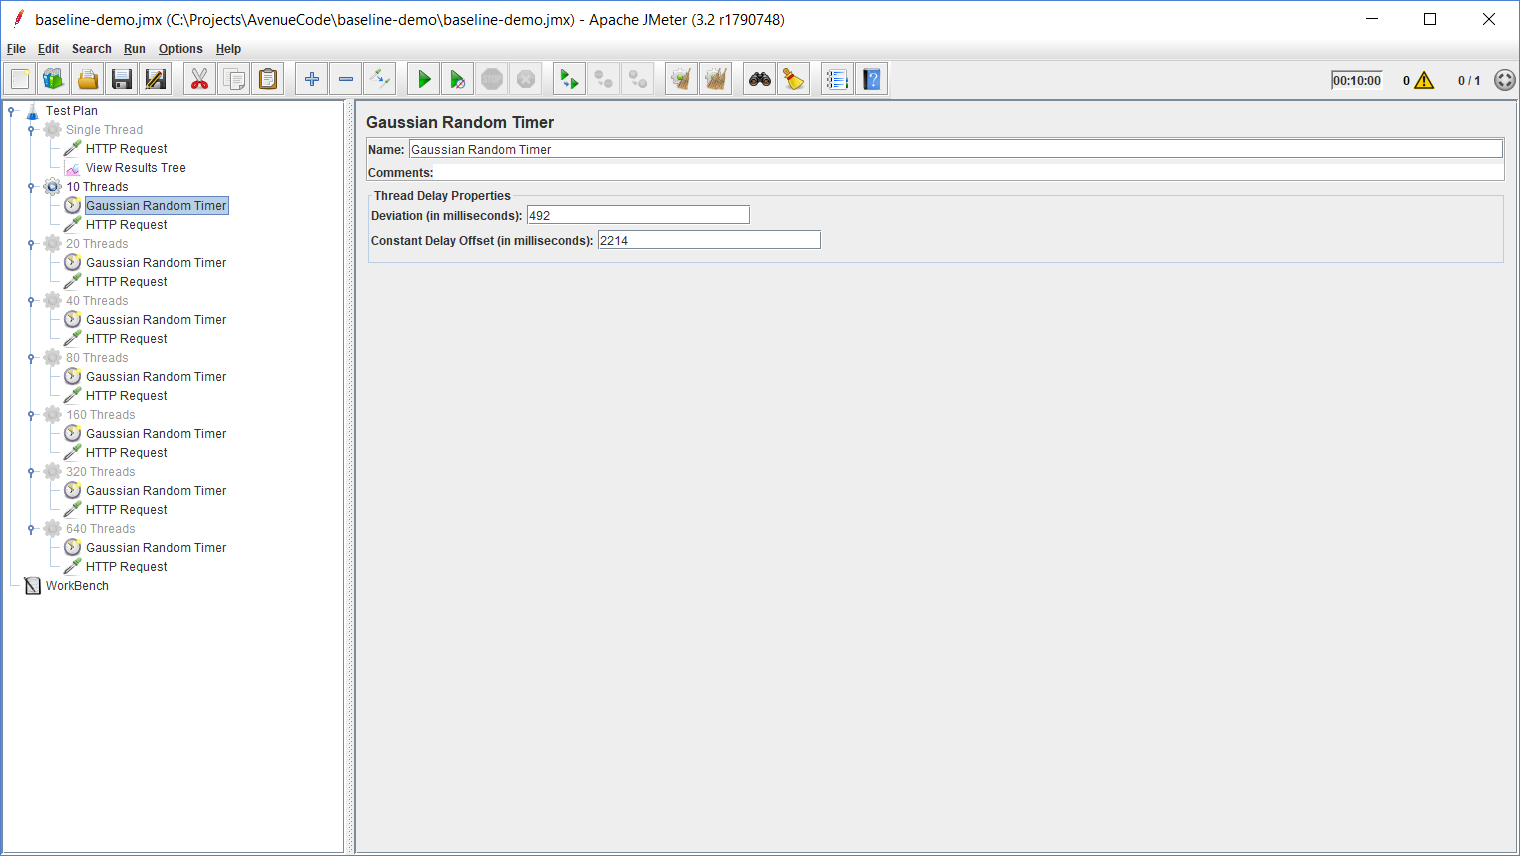
Next, we use this reference response time to configure the Gaussian Random Timer for a second thread group, where we will have 10 threads querying our service endpoint.
To determine the Offset and Deviation values for the Gaussian Random Timer, we follow these steps:
- For the Constant Delay Offset, multiply the average response time of the single thread requests (in this case 246ms) by the number of threads (10) minus 10%: (246*10)-(246*10*0.10) = 2,214.
- The Deviation must be twice the 10% we remove from the Offset (in this case (246*10*0.10)*2=492).
 Before we proceed, let's review exactly how we use these values:
The Gaussian Random Timer will be used to delay the requests so that we can control the throughput of our service. This delay is the time jMeter will wait between two consecutive requests performed by the same thread, and its value is the fixed Offset plus a random value ranging from zero to the informed Deviation. In other words, if we have 2,214 as our Offset and 492 as our Deviation, it might have a delay ranging from 2,214 up to 2,706, which will give us an average of 2,460, which is 10 times our average response time for a single thread. This way we can ensure that, though we use 10 times more threads, we are still putting the same average load over our service and also varying the number of requests.
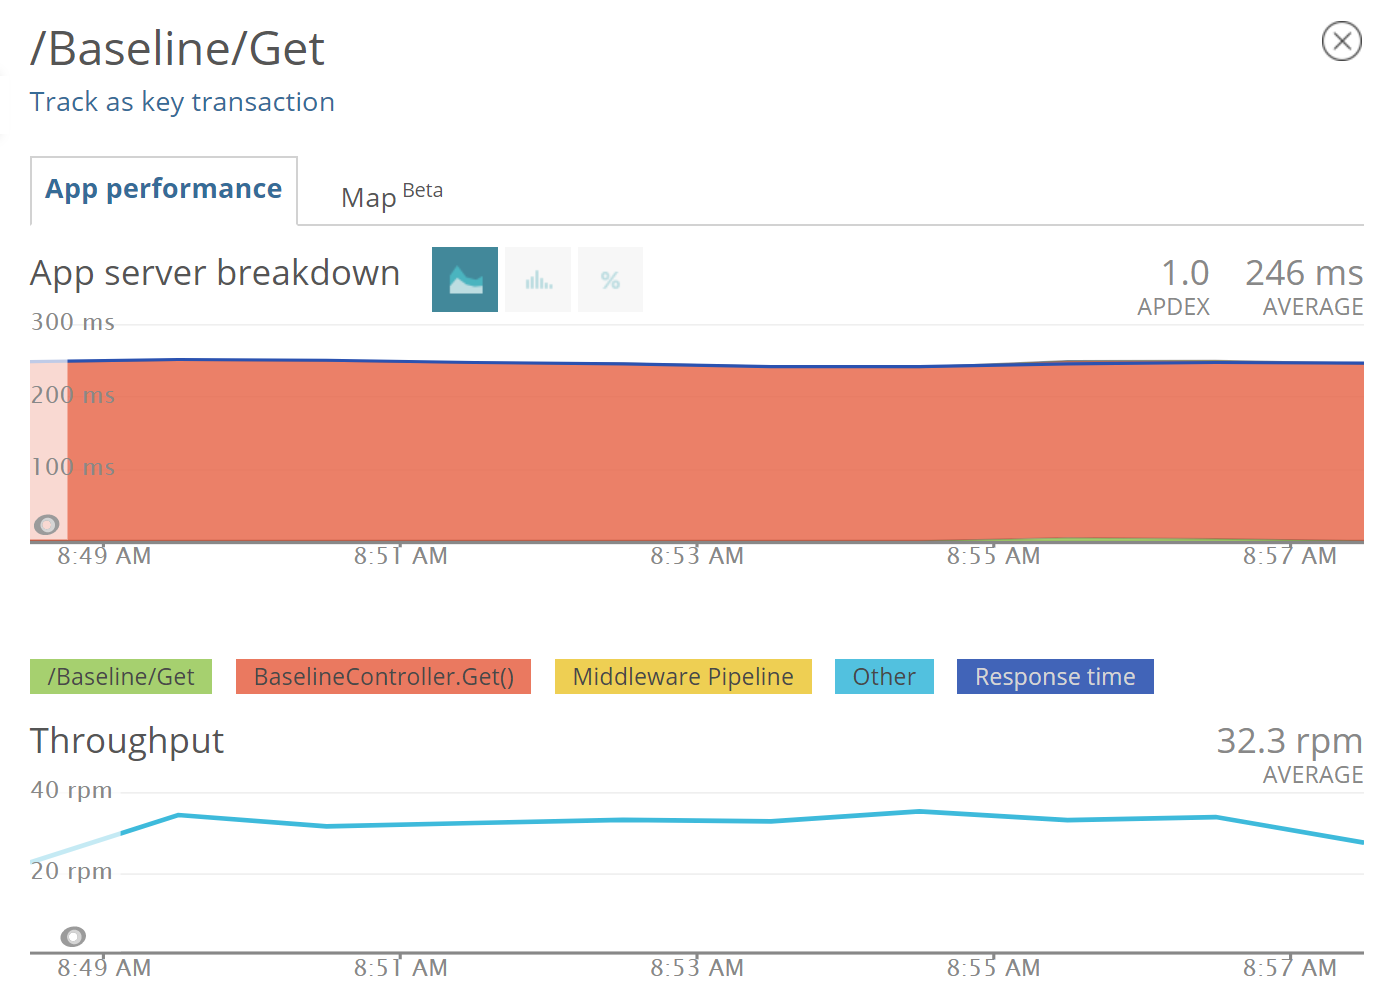
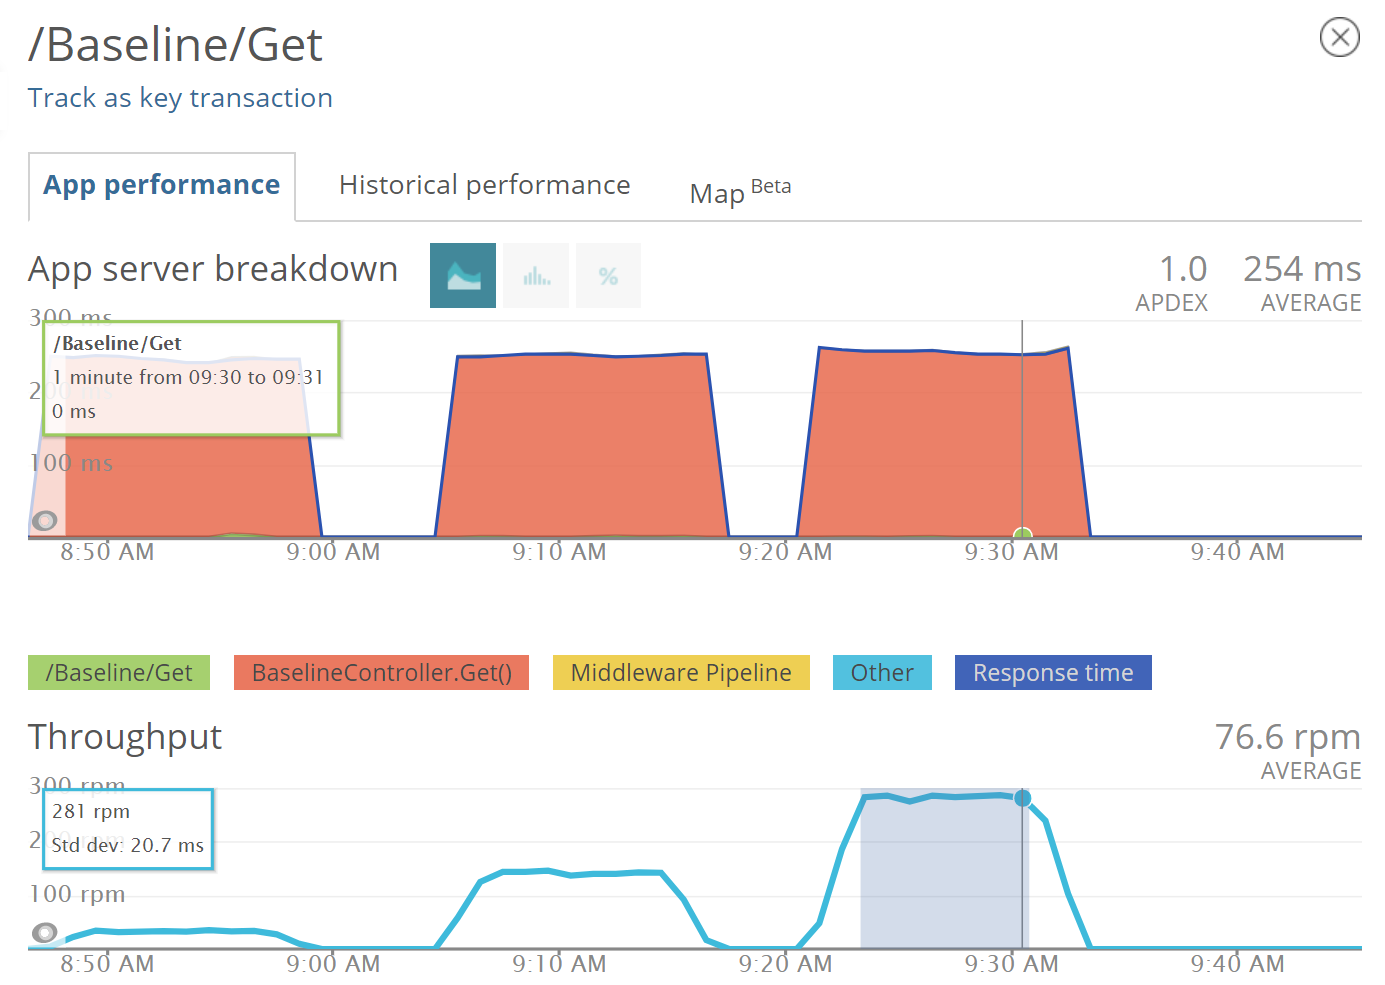
The metrics in New Relic will show us we still have the same average response time:
Now, we repeat this process for 20, 40, and 80 threads, keeping the same values for our Offset and Deviation, which should give us a variation in the throughput proportional to the variation in the number of threads while keeping the same average response time.
Notice that if we modify the Offset and variation values again, according to the number of threads, we would keep the throughput the same, along with the average response time. This way we would not be able to stress our API.
So, for 20 threads we have:
And for 40 threads:
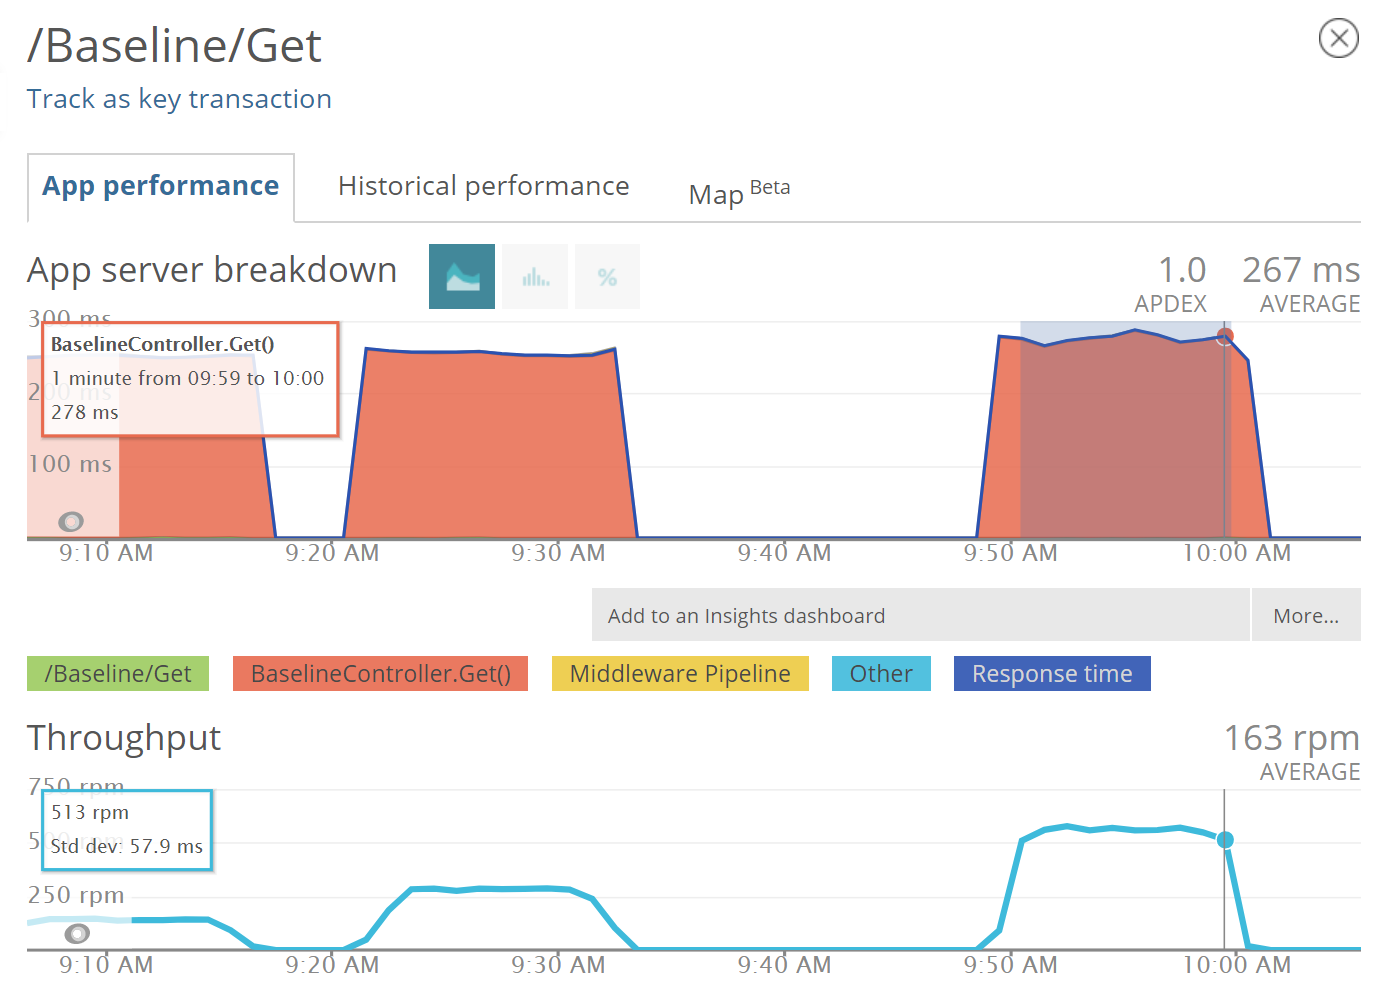 Notice that with 40 threads we already can see some variation in the response time of our API endpoint. If we repeat the process with 80 threads, we can see that it is no longer able to respond as expected:
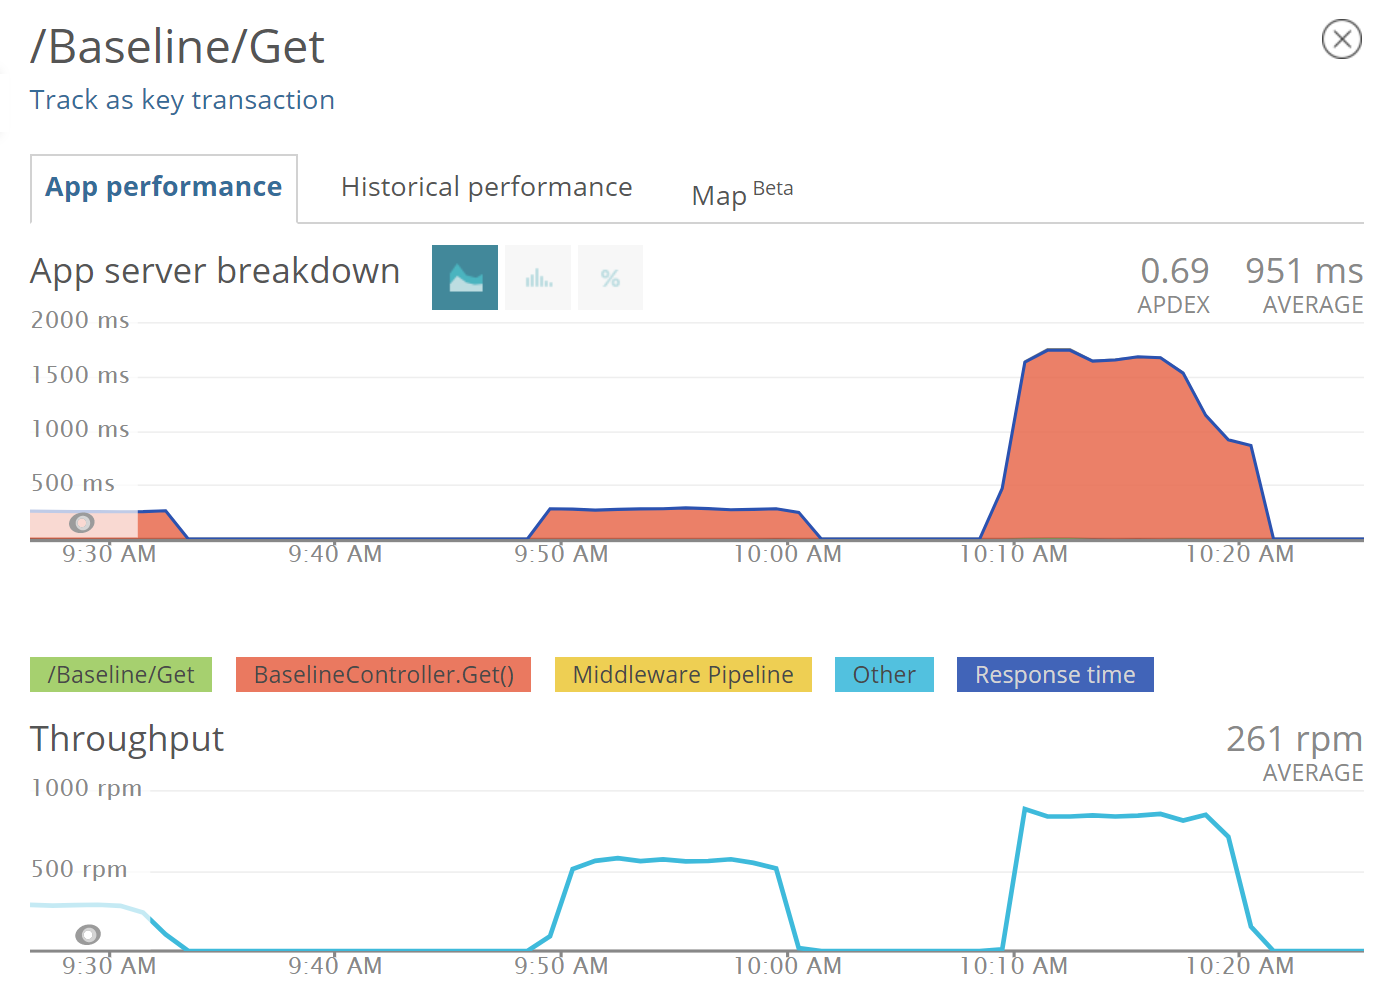 Our response time varies a lot and is far higher than the average we could keep using up to 40 threads.
If we repeat it with 30 threads, then we go back to a better state, like we had using 20 threads:
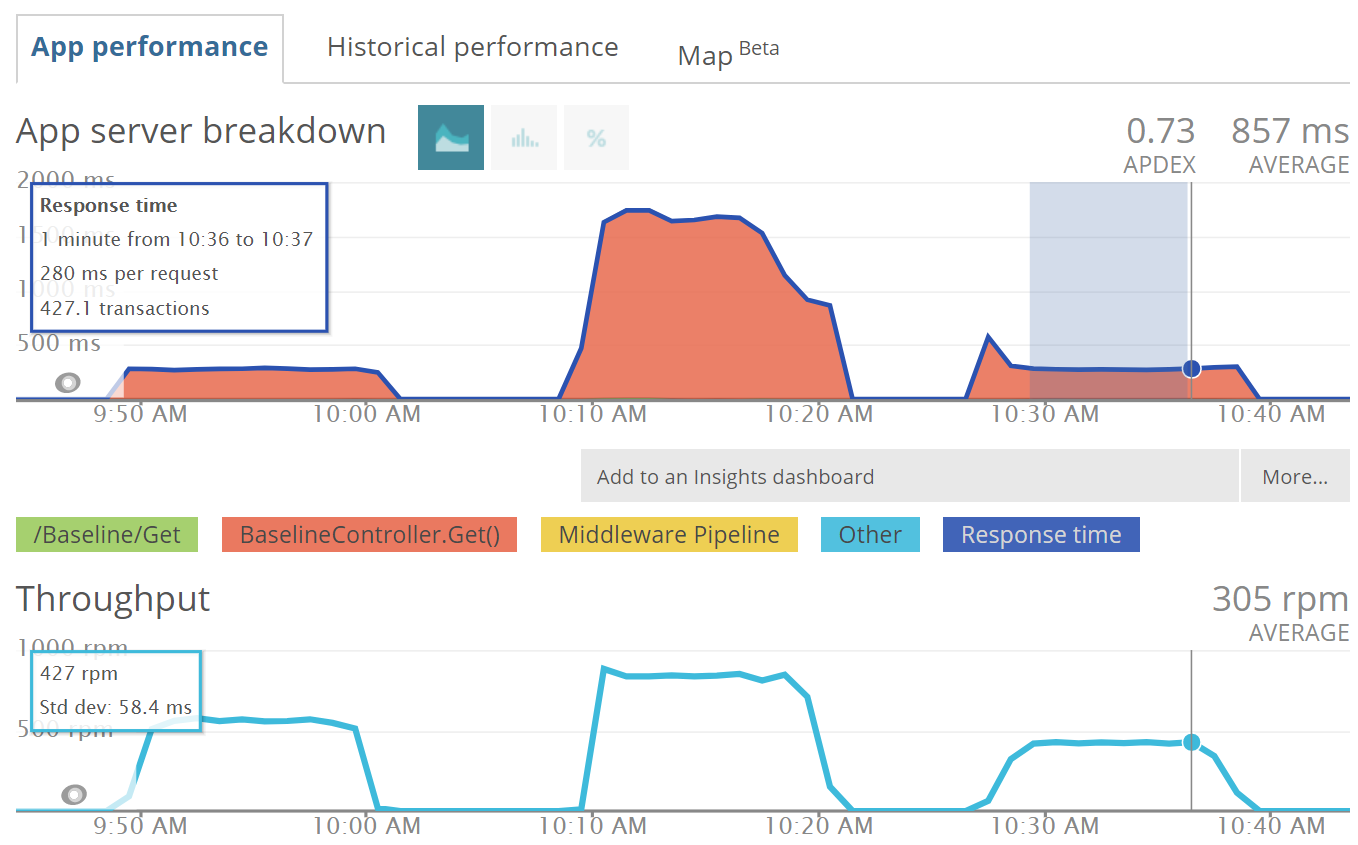
From this data, we can conclude that an average response time of ~250ms at up to 305rpm is the baseline performance for our API endpoint.
What Now?
After determining your performance baselines, a good practice would be to write some performance tests, using Jenkins, for example, to check if the baseline is still the same. It's advisable to run these every other night so that you'll know if something starts harming the performance of your Web API.
You can also integrate this kind of test in your build pipeline so that you can make sure a new version is not slower than the previous one.
If you have any comments or questions about this topic, let's talk below.


