
Important note: this blog contains a brief summary of the developments of the Black Friday DataSet use case. For more details and information, please access the complete official document of this work.
In this blog post, we outline the critical steps to ensure the delivery of a machine-learning solution, focusing on serving a predictive model for the Black Friday dataset, stored in Google Cloud.
Key Business Need: The necessity to understand sales and customer behavior for a set of high-volume products involved in Black Friday events. The retail company in this use case aims to gain detailed insights into these behaviors and leverage data-driven strategies to enhance operations and profitability.
Solution Approach:
- Understanding Sales and Customer Behavior:
- Analyze sales data to uncover patterns and insights regarding customer behavior and product performance during Black Friday events.
- Use this understanding to inform planning and actions that improve operations and profitability.
- Sales Predictions:
- Develop predictive models for product sales during Black Friday events based on features such as customer demographics and product categories.
- Enable the retail company to implement targeted marketing campaigns for specific customer segments with lower average purchases.
Outcome: By combining sales predictions with associated costs, the company can estimate profits for various customer segments and identify opportunities for improvement.
Business Goals for the Demo:
- Gain Insights:
- Extract valuable business insights from the Black Friday sales dataset.
- Predictive Capabilities:
- Develop a machine learning solution to provide reliable sales predictions, allowing the company to tailor actions based on different customer behaviors and product categories to improve profitability.
Machine Learning Use Case: The use case involves creating a comprehensive machine learning workflow, from data exploration to model deployment, exclusively using Google Cloud services.
Model Deployment: The selected model, a Random Forest Regression, will be deployed in the Google Cloud Model Repository. This deployment enables the model to receive requests and provide forecasts for purchases by different customers across various demographics and product categories during Black Friday events.
Objective: Develop a predictive model for Black Friday sales to aid the company in creating personalized marketing actions for different customer and product segments and understand sales trends.
Data Sources: Two datasets provided by Kaggle: a training dataset and a testing dataset.
Definition of Done: The project is complete when a full workflow, from data exploration to model deployment and testing, is presented. The objective is to make a machine learning model available for predicting Black Friday sales durations, ending with a practical test of the deployed model.
Data Exploration
Key Elements to Describe:
- Methods and types of data exploration performed.
- Decisions influenced by data exploration.
Required Evidence:
- In the whitepaper, include descriptions of the tools and types of data exploration used, along with code snippets demonstrating the process.
- Explain how data exploration influenced decisions regarding data/model algorithms and architecture.
-
Detailed Description of Data Exploration Process
Types of Data Exploration Implemented:
- Familiarization with Variables:
- Understand each variable in the train and test datasets.
- Identify data types and potential changes needed.
- Data Cleaning:
- Identify columns to discard for predictive modeling.
- Determine empirical distributions and necessary transformations.
- Correlation Analysis:
- Conduct correlation analysis to decide which variables to retain based on identified patterns.
- Handling Missing Values:
- Identify and decide on actions for missing values in the dataset.
- Data Transformations:
- Evaluate the need for transformations and scaling to develop a predictive solution.
- Outlier Detection:
- Check for and address outliers in the dataset.
- Dataset Preparation:
- Copy train and test datasets to a specified Cloud Storage bucket.
- Visualize datasets as pandas data frames to check data types.
- No irrelevant variables or data type changes were identified.
- Data Analysis:
- Analyze distinct values and detect missing values in
Product_Category_2andProduct_Category_3. - Discard
Product_Category_3due to excessive missing values. - Remove rows with any remaining missing values.
- Analyze distinct values and detect missing values in
- Data Transformation:
- Label encode categorical variables for regression model training.
- Analyze empirical distributions and check for significant outliers.
- Explore purchase behavior by examining average purchases grouped by other features.
- Correlation Analysis:
- Detect significant correlations among certain features.
- Retain all variables despite identified correlations for comprehensive model training.
Key Findings in Data Exploration:
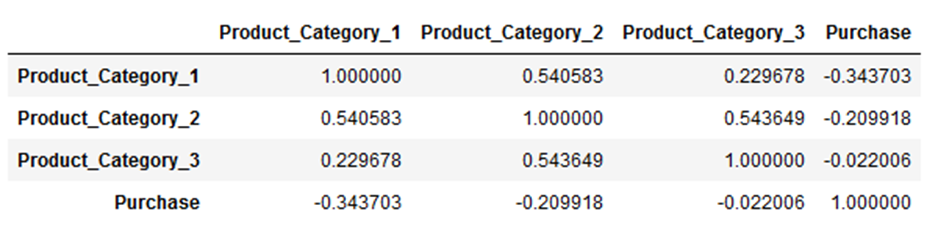
- Correlation Patterns:
- Significant correlation between Product_Category_1 and Product_Category_2 (0.54).
- Noteworthy correlation between Product_Category_1 and Product_Category_3 (0.229).
- Negative correlation between Product_Category_1 and Purchase (-0.3437).
- Negative correlation between Product_Category_2 and Purchase (-0.2099).
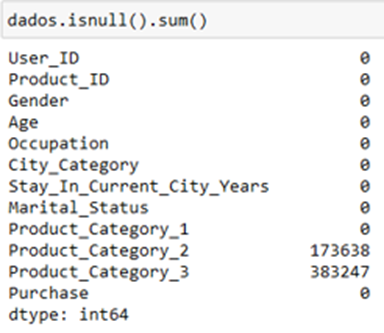
- Handling Missing Values:
- Detected in Product_Category_2 and Product_Category_3.
- Discarded Product_Category_3 due to excessive missing data.
- Retained original records to avoid data imputation.
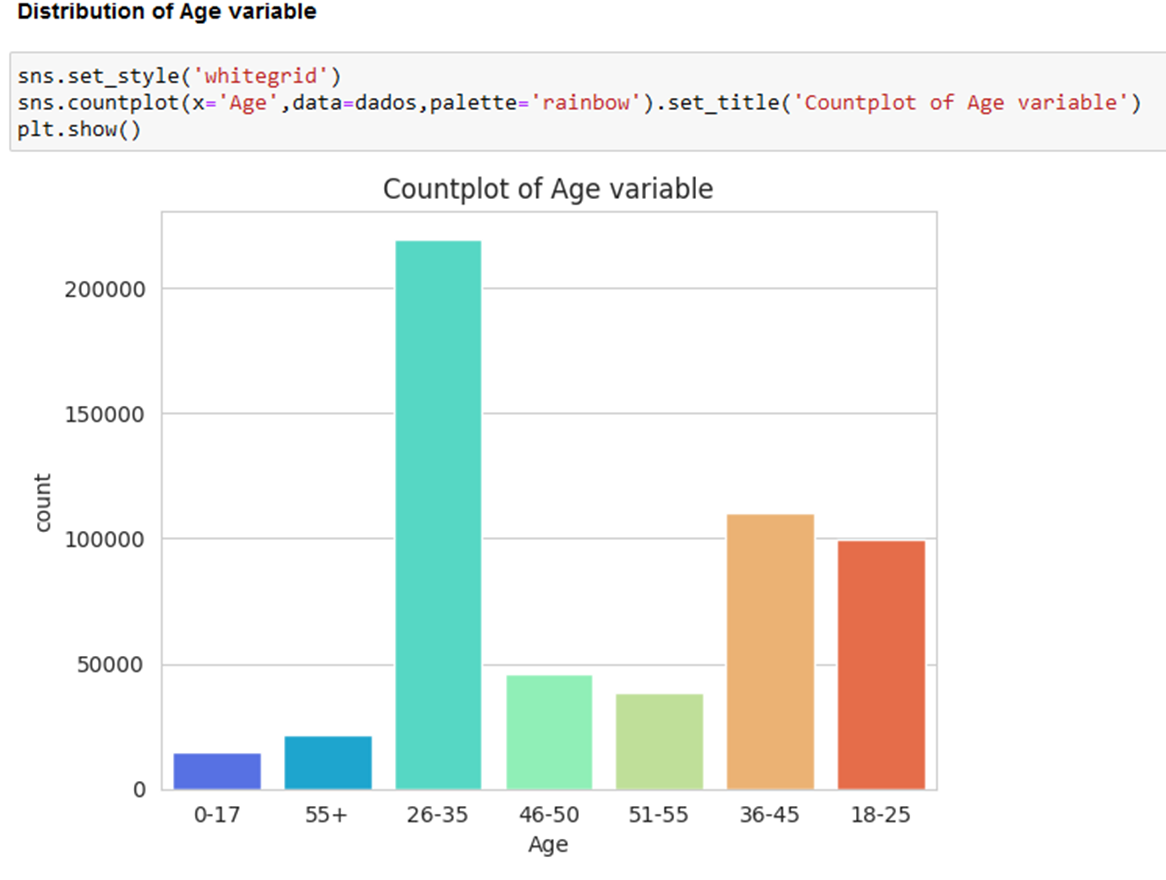
- Variables Distribution:
- Age group 26-35 most frequent during Black Fridays.
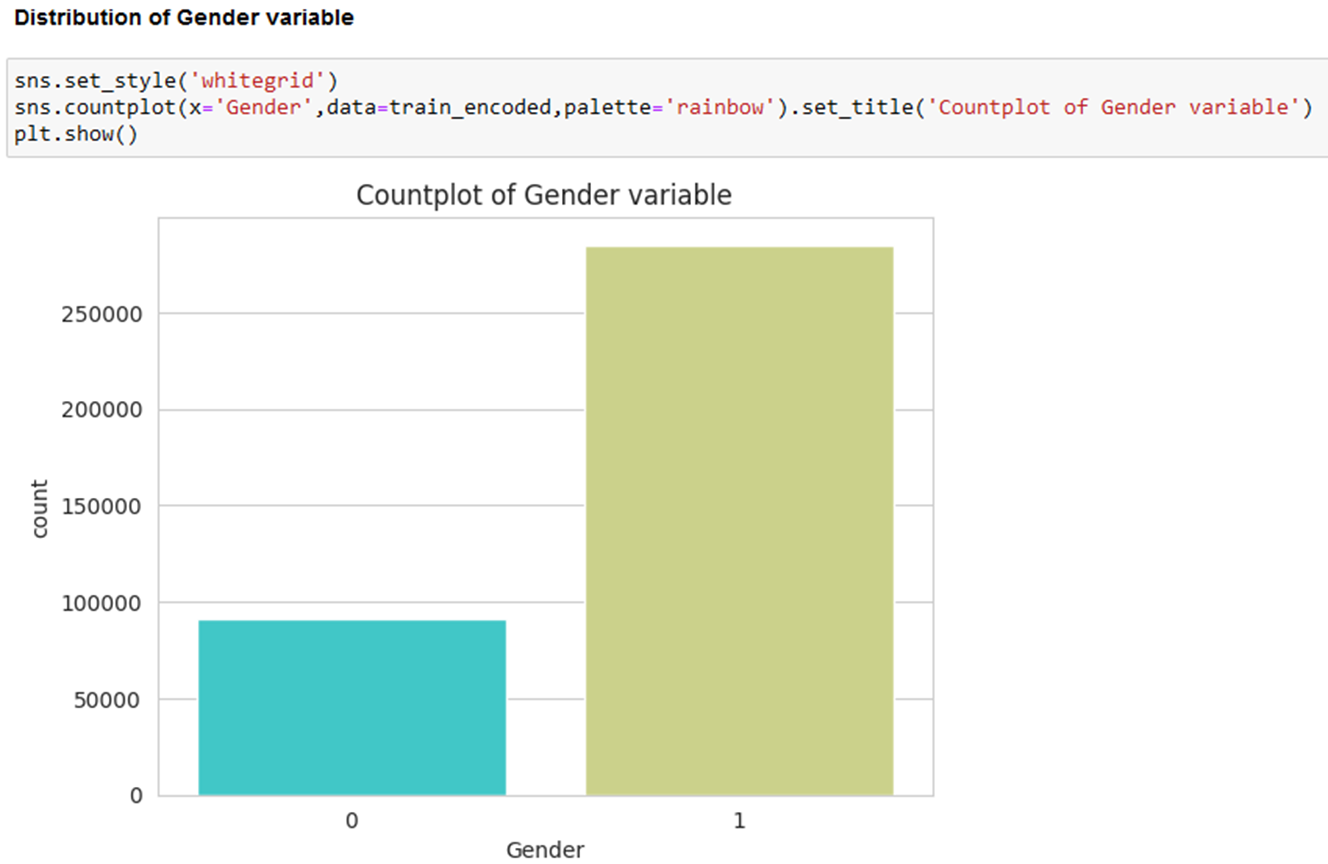
- Male customers predominant in Black Friday events.
- City category B has the highest customer frequency.
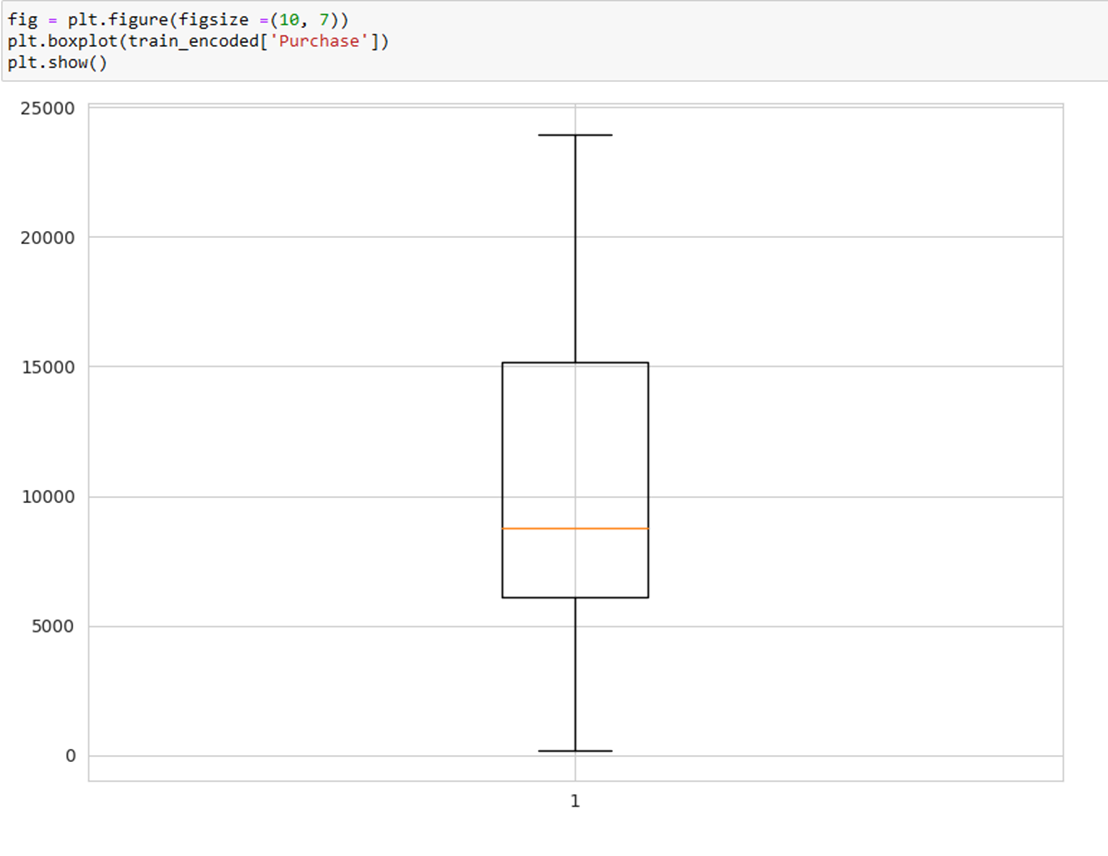
- Purchase distribution is irregular, with frequent purchases between 5000 and 10000.
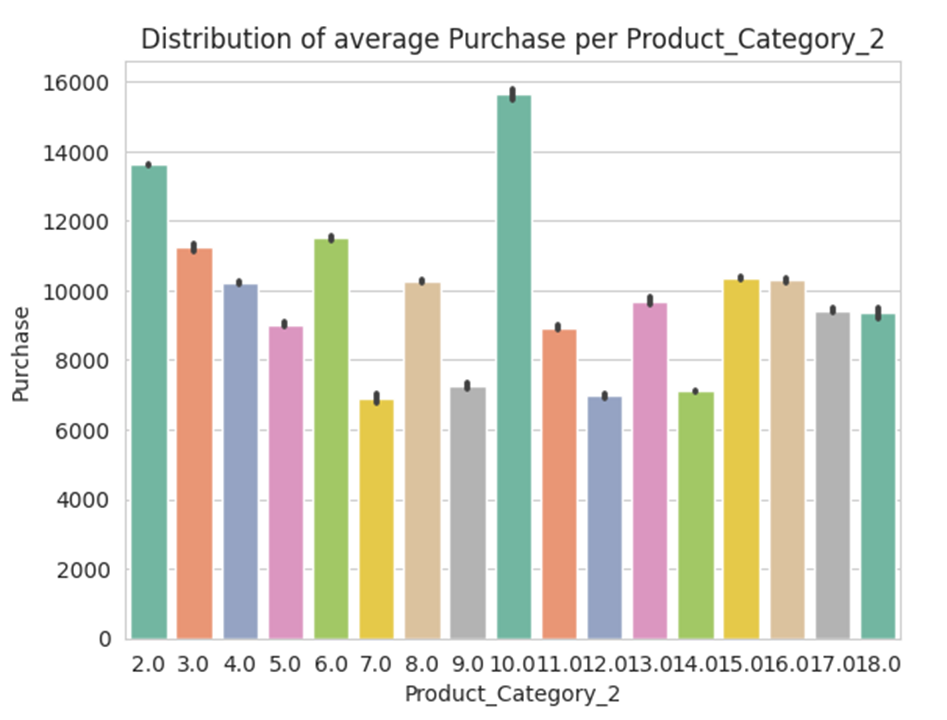
- Highest average purchases found in Product_Category_2 values 10.0, 2.0, and 6.0.
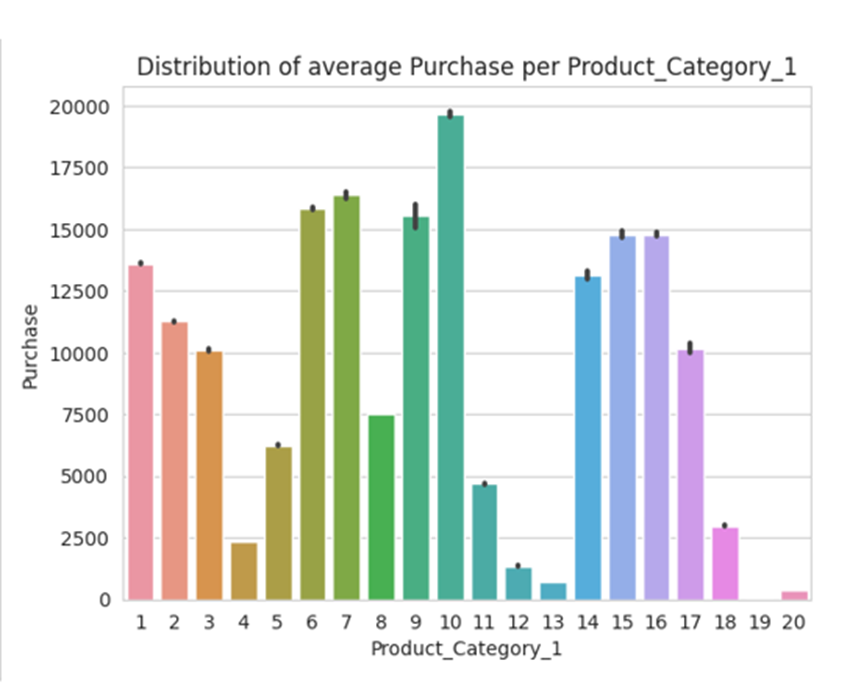
- Highest average purchases in Product_Category_1 categories 6, 7, 9, and 10.
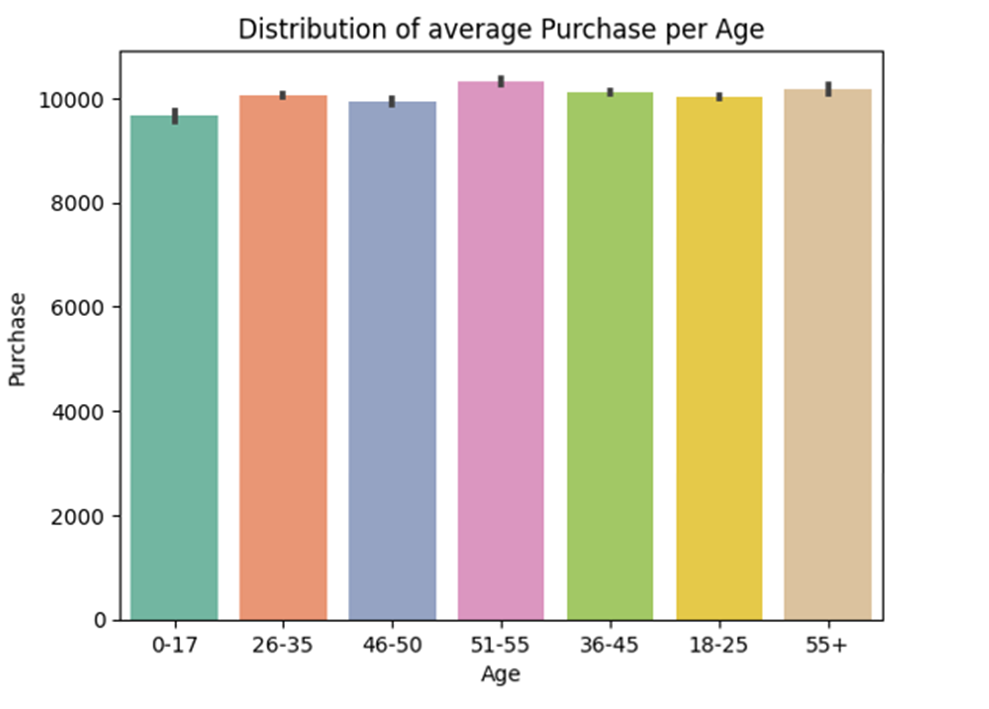
- Highest average purchase in age range 51-55.
Code Snippets and Visuals:
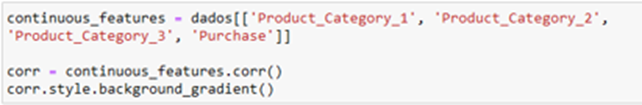
- Correlation Matrix:
- Handling Missing Values:
df.drop(columns=['Product_Category_3'], inplace=True)

df.dropna(inplace=True)
- Label Encoding:

- Age Distribution Visualization:
- Gender Distribution Visualization:
- Purchase Distribution Boxplot:
- Average Purchase per Product_Category_2:
- Average Purchase per Product_Category_1:
- Average Purchase per Age Distribution Visualization:
By following these detailed steps and utilizing the provided code snippets, the data exploration process can be effectively accomplished.
Feature Engineering for Machine Learning Model Development
Feature Engineering Steps:
- Elimination of Product_Category_3: Removed from both train and test datasets due to excessive missing values.
- Elimination of Remaining Missing Values: Any rows with missing values were discarded.
- Label Encoding of Categorical Variables: Converted categorical variables to numerical values using label encoding.
Data Preprocessing and Final Data Strategies
All preprocessing steps align with the feature engineering steps detailed above. No train-test split was required as Kaggle provided pre-split datasets.
Train, Validation, and Test Splits
Kaggle provided separate train and test datasets. Validation sets were created using a 4-fold cross-validation during model training and validation.
Preprocessing and Data Pipeline
All preprocessing steps are consistent with the feature engineering processes previously described. No additional train-test splitting was necessary due to Kaggle's pre-split datasets.
Machine Learning Model Design and Selection
Proposed Machine Learning Model
For this demo, we selected Random Forest Regression models due to their:
- Strong performance across various industries and academic settings
- Ease of interpretation and explanation to non-technical stakeholders
Specifically, Random Forest Regression was chosen to predict the total purchases made by different customers for various products during Black Friday events.
The criteria for model selection was the explained variance score in the cross validation schemas, using a 4-fold Cross-validation alongside hyperparameter tuning using GridSearchCV, testing different numbers of decision trees (5, 10, and 15). The number of folds used in the Cross-validation was chosen basically because of the previous experience with such models, and squared error and explained variance were used as performance metrics, with a threshold of 95% for explained variance to prevent overfitting. Code snippets demonstrate the training, validation, and model selection process.
CODE SNIPPET:
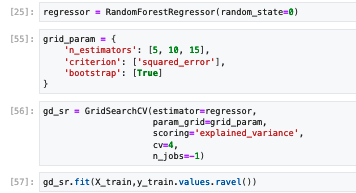
The best performing model in the train validation session was a Random Forest made of 15 decision trees, as depicted in the code snippet below:
CODE SNIPPET:

Used Libraries
We used the following libraries for this machine learning project:
- scikit-learn: For model training, evaluation, and testing
- Matplotlib and Seaborn: For data visualization
- Joblib and Pickle: For exporting the final model artifact (with joblib used exclusively for model deployment)
Selecting the Best Performing Model:
- A Random Forest model with 15 decision trees showed the highest cross-validation score.
Machine Learning Model Training and Development
In this demo, model training was conducted using Vertex AI Workbench with dataset sampling provided by Kaggle, avoiding the need for any splitting method. Adherence to Google Cloud's best practices was ensured through the use of Vertex AI for distributed training, appropriate resource allocation, and monitoring. The explained variance metric was chosen for model evaluation due to its ability to measure how well the model fits the data while controlling overfitting, which is critical for predicting purchases during Black Friday events. Hyperparameter tuning was performed using GridSearchCV, optimizing the number of decision trees to balance bias and variance. Bias/variance tradeoffs were carefully managed by adopting the threshold value for explained variance of 95%, to decide whether a given model overfitted the data or not. The Model evaluation metric used in the cross validation scoring, as explained before, was the explained variance. This choice is justified because we are considering a model that predicts well the purchases made in Black Friday events, but at the same time, a model that generalizes well on new datasets.
Hyperparameters tuning and training configuration
As explained in the previous section final model hyperparameters were defined from a Grid Search CV proceedment. we have decided to train different models using different numbers of base estimators (decision trees) , considering models with 5, 10 and 15 decisions trees.
Model Evaluation Metric:
- The explained variance was used to score models during cross-validation, with a threshold of 95% to indicate potential overfitting.
Hyperparameters Tuning and Training Configuration:
- Only the number of decision trees was varied due to time and resource constraints.
- All data from the train.csv file (post-cleaning) was used in the training process.
Dataset Sampling
No additional splitting was necessary since Kaggle provided separate train and test datasets. The entire cleaned train dataset was used for cross-validation training.
Machine Learning Model Evaluation and Performance Assessment
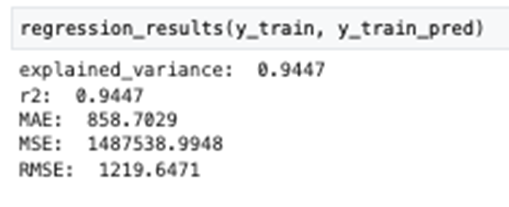
Regression Metrics Assessed on Training Set:
- Explained variance
- R2 coefficient
- Mean Squared Error (MSE)
- Mean Absolute Error (MAE)
Final model explained 94% of data variance in train set, as below:
Adherence to Google’s Machine Learning Best Practices
Regarding adherence to Google`s Machine Learning Best Practices, we followed several best practices, such as:
- Maximize model`s predictive precision with hyperparameters adjustments.
- Prepare models artifacts to be available in Cloud Storage: this was accomplished in Demo 1 where models`s artifacts were made available in joblib format (model.joblib files).
Fairness Analysis
Possible Biases and Fairness Considerations:
- Temporal Bias: The dataset may reflect atypical consumption behavior due to specific time periods influenced by external factors like political or geopolitical events.
- Seasonal Bias: Data collected may be influenced by seasonal trends, which may not represent general behavior.
- Sampling Bias: The dataset might result from an incorrect sampling process, lacking representativeness of broader consumption patterns.
Steps to Mitigate Bias:
- Business and Industry Comparison: Validate data representativeness by comparing it with similar datasets from other companies.
- Representative Sampling: Ensure data collection spans different periods to capture various consumption behaviors.
- Complex Sampling Strategies: Implement strategies like conglomerate and random sampling to obtain a representative dataset.
Socio-Economic Bias Considerations:
- Use data insights to identify special customer segments and develop targeted pricing or marketing strategies to improve their economic conditions, reducing bias in profit maximization strategies.
By addressing these biases, we can ensure that the model not only maximizes profits but also promotes social inclusiveness and fairness.


